Innovations in spatial computing and web 3.0 are being harnessed by organizations and governments around the world. Their accelerating use is creating a new civic architecture of the 21st century that will enact fundamental shifts in how the built environment is imagined, created, managed, and experienced. While these shifts might easily lead to increased degrees of inequality and dystopia over time, spatial computing and web 3.0 tools also offer positive trajectories for the future of civic space and decision-making. Specifically, they stand to enhance spatial visualization of our environs across time, space, and macro-environment context. Access to such trans-scalar spatialized information is a critical tool in moving from participation-focused systems of development to the more meaningful avenues of co-production that collaborative, care-based cities require.
Moving towards civic co-production is necessary. Even as calls for more participatory planning and development have grown over the past half century, achieving meaningful and effective participation remains elusive. Planning language can be complex and regulations labyrinthine, hard for the uninitiated to understand without assistance. Planning projects and departments often do not support the budgets needed to adequately provide that help. As a result, it’s typical for community engagement to occur just a few times throughout a project’s life span, resulting in frequent reports of community members feeling unheard, undervalued and unseen. For those who do get involved, urban planning’s arguably difficult legacy of exclusion and displacement can create contexts in which collaborative discussions become mired in anger and distrust.
These longstanding problems reinforce the fact that aiming for greater degrees of participation in urban planning does not adequately challenge the structural imbalances that maintain and exacerbate spatial and temporal inequities in urban space. Transforming planning systems towards more dynamic collaboration between top-down regulatory measures and resources and bottom-up development processes demands larger political and economic shifts. Co-production, which pushes for knowledge development through negotiation, collaboration, and the sharing of power, presents a conceptual framework for addressing the limits of participation by emphasizing strategies for power-sharing and cooperation in decision-making spheres.
Technological innovations in spatial computing and web 3.0 have the potential to implement the co-production framework through more dynamic, trans-scalar spatial visualization. Although research shows that spatial design is effective in articulating human-scale impacts of proposed interventions and facilitating collaborative decision-making, existing toolsets infrequently use it to visualize assessed effects across time and space, and even more infrequently across associated macro environment factors. Such patterns reinforce persistent trends of investigating political, technological, economic, ecological, and cultural repercussions in silo, which ongoing difficulties in data collection and causal pathway identification often exacerbate. Complementing computational tools with the visualization capabilities that spatial computing and web 3.0 innovations offer, can provide real-time, trans-scalar translation of policy and design proposal impacts, supporting stronger collaborative development as a result.
One of the ways they might do so is by improving existing participatory, spatially focused tools like design charrettes. Where present-day design charrettes often lack the funding to occur with the frequency which meaningful participation requires, web 3.0 and spatial computing systems offer avenues to enact the more iterative, ongoing, and collaborative planning and policy development that co-production demands. A bit more about the terms before going further:
- Design Charrettes are a type of participatory planning process in which interdisciplinary stakeholders create design and implementation plans for specific areas, that have long been employed in planning and decision-making work. The goal is typically to capture the vision, values, and ideas of participants to ensure that resulting decisions and interventions reflect public needs, concerns, and preferences.
- Spatial Computing relates to human interaction with machines in which represented space is linked to physical space through computational forces, often occurring via digital twins (virtual representations that serve as the real-time digital counterparts of physical objects or processes).
- Web 3.0 is the third major evolution of the internet. While web 1.0 was based on static desktop computers, and web 2.0 was the transition to a mobile internet, web 3.0 is often called the ‘spatial web’ because digital information will increasingly exist in 3D spatial contexts, connected to the physical world via decentralized data storage and spatial computing. Metaverse experiences are increasingly a product of web 3.0 innovations.
Together, innovations in spatial computing and web 3.0 offer the chance to digitize potent yet regularly under-resourced processes like design charrettes. Having more available, ongoing, and relatable spaces to understand and discuss potential impacts is key to making more informed, collaborative decisions about the future of civic spaces.
This is the potential reality that Civic Computing could enact. Over the past thirty years, computational tools have been used both to bolster deliberative civic processes and to undermine them. Whether they have positive or negative impacts depends entirely on how they are used. Synthesizing web 3.0 and spatial computing tools into a system of Civic Computing is an opportunity to aim for positive impact, and supporti the deliberative and collaborative policy making that civic co-production demands.
Spatial visualization as an engine of co-production
Civic Computing is a move towards real-time spatial analysis of decision-making impacts across time, space, and macro-environment sectors. Visualizing information in spatial ways helps us determine relationships, identify preferred trajectories and paths, and understand, detect, and define patterns. Extending those visualizations across space and time is a potent tool for collaborative development and complex coalition building. Decisions made at national levels often have impacts at local and family levels. Economic decisions frequently have environmental repercussions. The decisions we make today shape how life will unfold in coming years.
Smart decisions about increasingly complex issues depend on assessing and understanding and working with such trans-scalar ties. When it comes to affordable housing policies, for example, we need to be able to explore potential impacts on employment rates and job types over time. When people have affordable housing, do they feel less pressure to keep going to jobs they don’t want to do? If people are leaving undesirable jobs, how might they use their time differently throughout the day? What does work look like in this potential reality? What does it look like at a neighborhood scale or a megaregion? What impacts on economic development might it effect in five years, or thirty? Making wise choices depends on exploring how interventions might unfold across these distinct yet intrinsically connected areas of time, space, and macro-environment sector.
Spatial visualization helps make the answers to these questions personal. Imagine being able to explore how proposed projects and policies would affect your environment in the moment, and understand the impacts of those effects across space and time -- from the neighborhood to the mega-region scale, from tomorrow to fifty years into the future. Imagine being able to explore how renovating sewage infrastructure along your street might affect energy prices in your region over time. Thinking through those consequences is arguably most powerful when we connect them to our daily lives. Those personal level impacts can often be spatialized. Translating the abstract to the concrete can allow for greater degrees of collaboration in debating and refining desired impacts of proposed policy moves.
Doing so requires going beyond the confines of existing software. Programs like GIS analysis, City Engine, Revit, Maya, and Rhino – which can spatially assess potential scenarios of urban environments in 2d and 3d form – are undeniably powerful ways of exploring existing and possible conditions using available and attributed databases. Yet visualizing the interconnected complexities of relevant systems, let alone doing so spatially and across different scales of time and context, remains difficult to do. Relying on data alone presents difficulties in everything from knowledge discovery, data aggregation, and data comparison to identification of what exactly causes what else to occur. Simply finding the right data is hard. Putting it in the right form for assessment is taxing. Identifying with statistical confidence what is a cause compared to a correlation is often impossible.
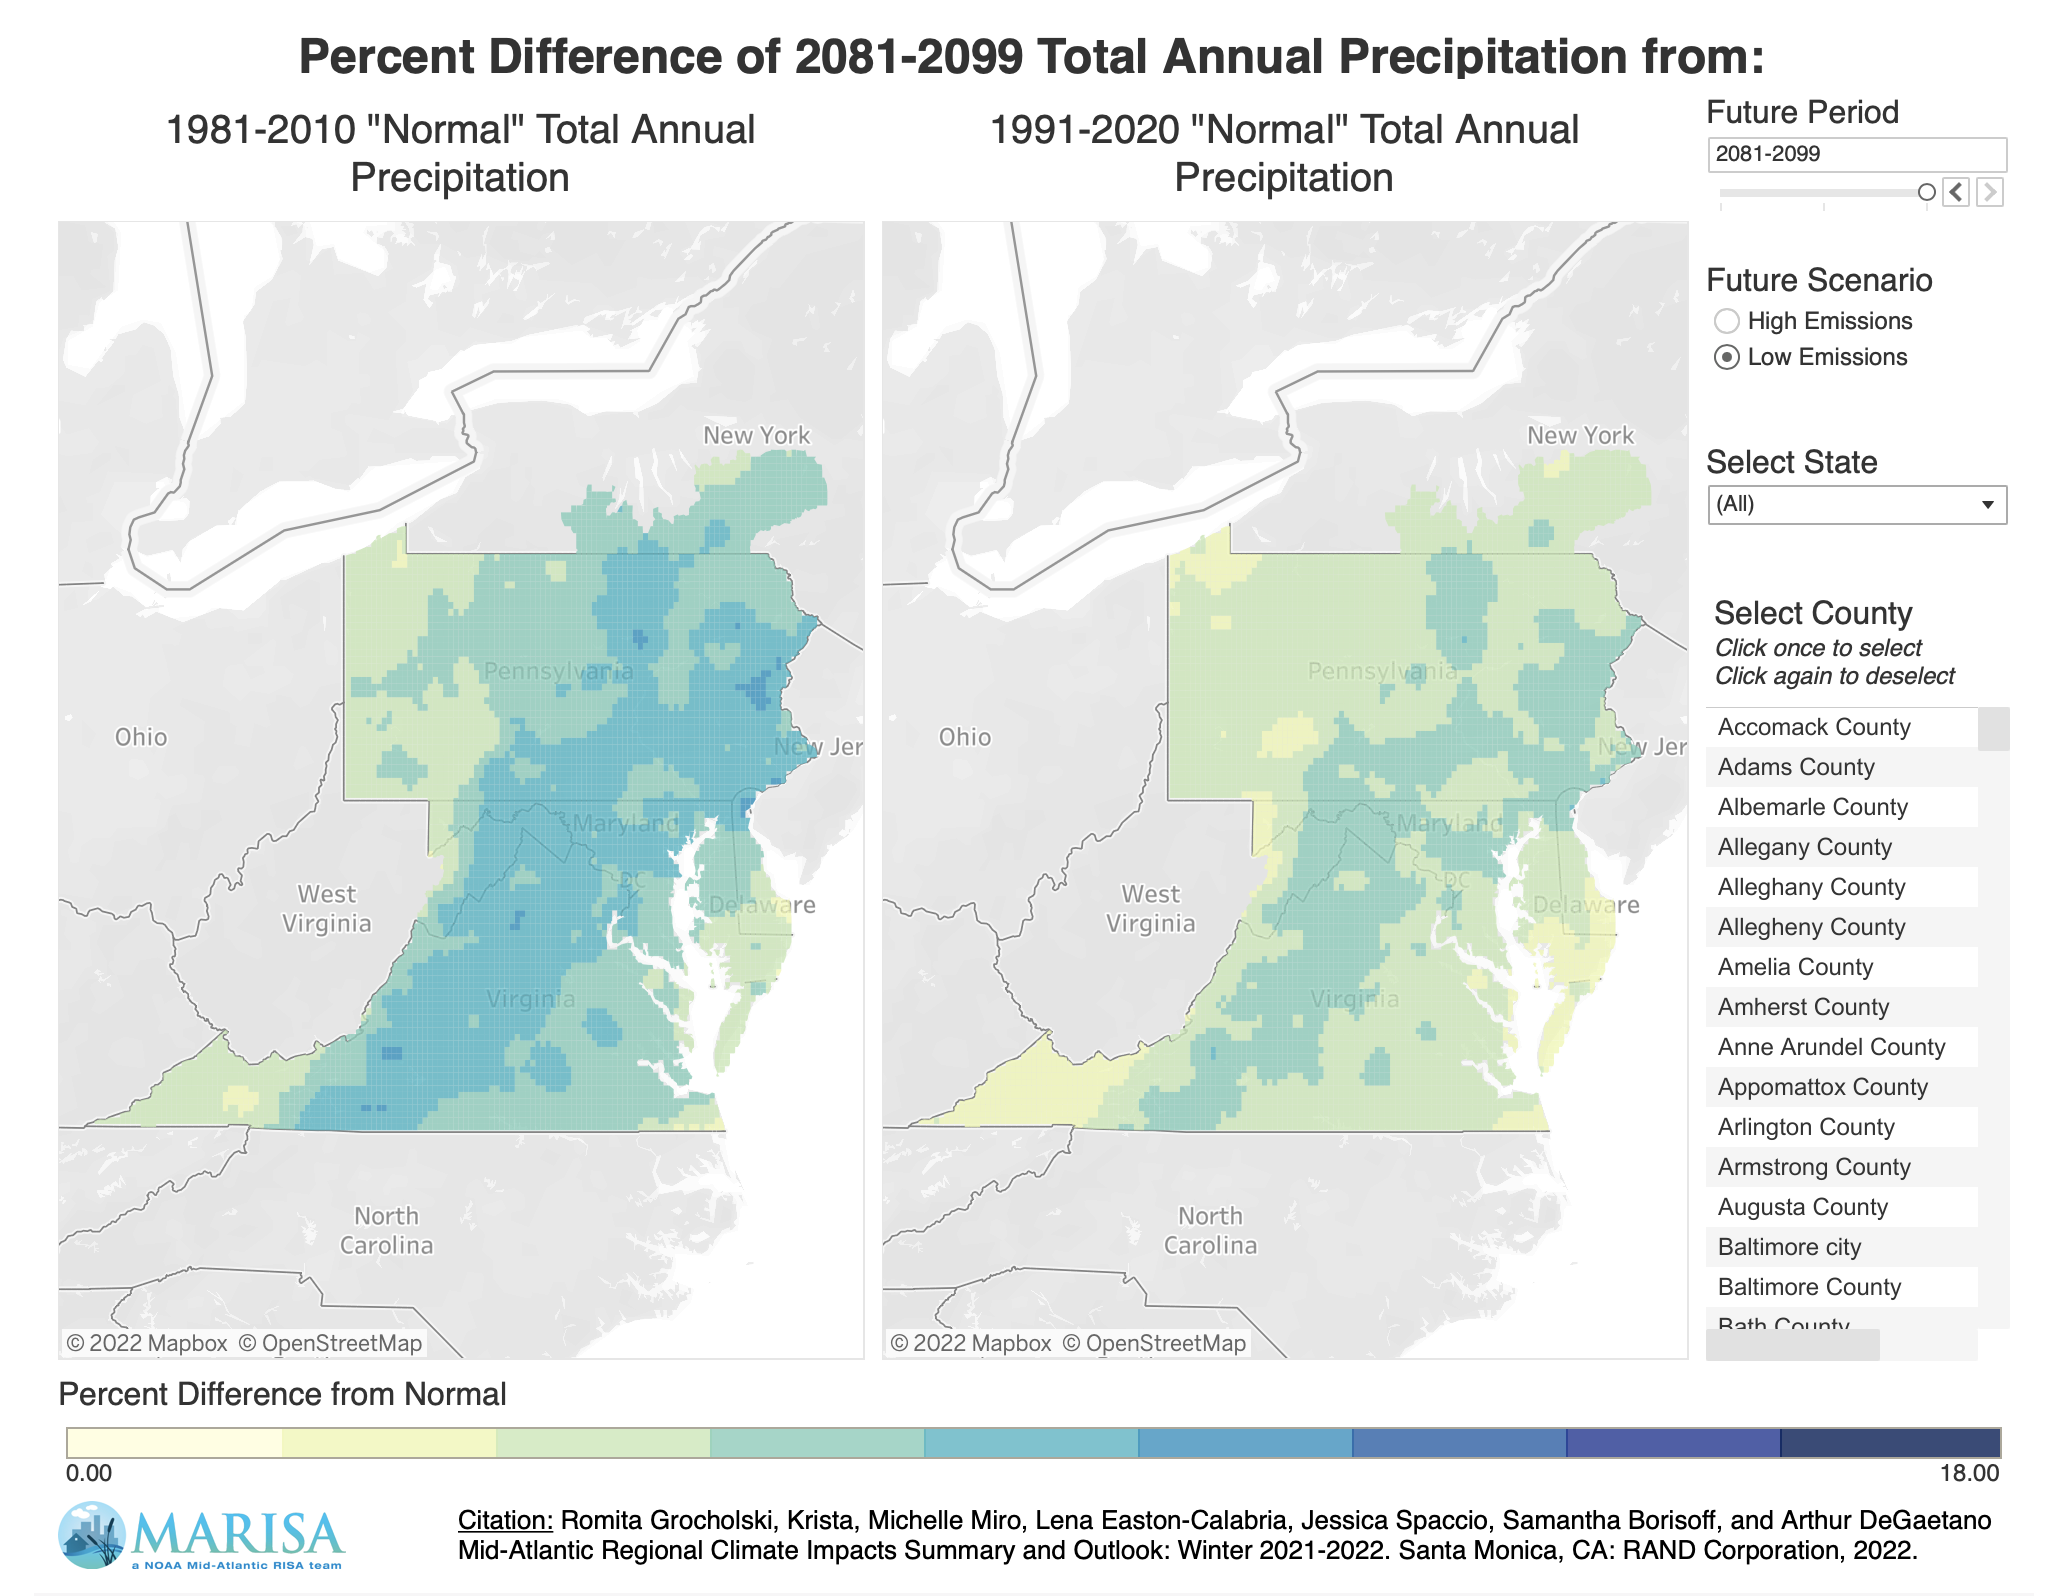
Spatial analysis programs like GIS are powerful tools but are still not capable of exploring how regional level impacts might affect neighborhood scales and/or individual people's lives. (Grocholski et al, 2022)
These difficulties contribute to a widespread hesitancy in exploring real world impacts of proposed decisions, particularly across scale, time, and macro-environmental factors. Yet those trans-scalar impacts are increasingly necessary to investigate. As climate change intensifies precipitation in many regions of the world, we know that more flooding will likely ensue. If more flooding occurs, might that also result in hotter temperatures, particularly during summer months? If temperatures increase, what does that mean for urban tree canopies? Could there be die offs if older species can’t adjust to new spiking temperatures? Should there be proactive plantings of new species as a result? If there are not proactive plantings of new species, and more heat wave events occur while tree canopies are dying off, could there be more human deaths due to the lack of cooling capacities that trees canopies provide? If more deadly heat wave events occur, what does that mean for local energy grid safety? For local work forces and regional economic vitality over time?
Obtaining the data to answer any of those questions with statistical confidence is challenging, but effective policy depends on trying to answer them regardless. In order to do so, to understand the impacts of potential change, we have to be able to extrapolate about potential impacts even when ideal data sets are not available. In coming years, as applications of big data and artificial intelligence expand, gaps in relevant data might be less of a problem. For the near future, however, it’s an issue that’s likely to persist. So the question becomes, how can we create a system of trans-scalar spatial visualization today capable of embracing changes in spatial computing and web 3.0 in decades to come?
Embracing imagination and narrative inference
Visualizing the connections between the multiple systems that shape the environments in which we live is the computational and informed-based landscape towards which we have the opportunity to move in coming years. Civic Computing ushers in this landscape by harnessing imagination and narrative inference. When relevant data is not available and available software programs do not adequately assess potential impacts across time, space, and sector, imagination can offer powerful means to fill in the deliberative gaps.
This imagination-based practice is widely used in design approaches like worldbuilding. A growing field of research and design practice, worldbuilding is an avenue for articulating worlds with strong rules, histories, climatic contexts, and social dynamics, providing a valuable framework for multiple participants to share connected stories. Worldbuilding uses the imaginative and narrative space to synthesize strains of primary and secondary research in order to understand what the human-scale impacts of potential policy and technological trajectories might be. The more detailed a world becomes, the more questions it can be asked, providing an increasingly nuanced space for exploring the potential repercussions and opportunities stemming from possible future change.
 Diagrammatic tools from design approaches like worldbuilding align information across scales of space and macro-environmental factor. Here, space is delineated through the use of concentric circles, with impacts at street corner scales indicated in the center-most circle, and mega-region and world level scales at the outer-most. (Experimental Design, 2020)
Some of the diagrammatic tools used to build such worlds can be a way of assessing how complex questions about trans-scalar systems can be framed and links between seemingly disparate areas of policy and research identified over time. Visualizations are crafted to organize information across spatial scales, as well as macro-environment factors – infrastructural, environmental, governmental, cultural, political – articulating how areas often explored in silo are fundamentally connected to and affect each other. Such 2d graphics can inform the development of 3d spatial visualizations that provide more nuanced levels of detail on trans-scalar impact. Understanding how changes in urban density over time might affect patterns of drone use and dynamics of city intersections, for example, can be felt more intimately when visualized across scales.

2D representations of trans-scalar impact can inform 3d explorations. Because many people are visual learners, 3d translation of complex information can prrovide more accessible form which often provide moremExperimental Design, 2020)
Rigorously imagining potential repercussions of proposed interventions, even when ideal data sets are not available, is an essential part of effective planning and policy work. Complementing existing computational tools for complex decision-making, such as those available in programs like GIS, with imaginative trans-scalar spatial design approaches like worldbuilding can serve to bridge silo-ed divides and support stronger collaborative processes as a result. Civic Computing is a means of expanding the use of spatial visualization across time, space, and macro environment factors to support the more informed and collaborative complex decision-making we need.
A tipping point for civic space
Crafting a system of Civic Computing is time sensitive. The current moment is a kind of tipping point, in which critical, collaborative evaluation can still inform how spatial computing and web 3.0 tools might be harnessed to improve longstanding issues of participation and inequity in urban planning and governance. Web 3.0 will transform how we relate to the internet, information, governance, and urban space. Being prepared for those transformations is essential to ensuring that collaborative, co-produced decision-making is a form of public infrastructure moving forward.
Innovations in spatial computing and web 3.0 provide opportunities for synthesizing these strains into an ongoing, interactive, and iterative framework that supports collaborative decision-making and stronger systems of civic co-production. As public code advocate Ben Cerveny writes, “We have the chance to collaboratively envision an ecosystem of creative tools that provide residents with safe places to express their ideas and hopes for urban change, and create a context of trust for creative, iterative, and informational outputs.” Connecting such a system to computational infrastructure could provide a more collaborative space for envisioning, strategizing, and implementing more co-productive, equitable urban environments.
The first step in ushering in that kind of future depends on creating a system of spatial visualization to regularly explore impacts of proposed decisions across time, space, and macro-environmental factors. The ways we visualize complex interconnected problems informs how we address those problems. Articulating a spatial language for complex decision making across spatial and temporal scales and macro environment factors is a means of shaping how we understand and intervene in this rapidly changing world.
Most importantly, spatial visualization is a language many people, including those without formal training in planning or policy related process, intuitively understand. Many of us can pin-point ideas for what futures or design interventions we prefer if we have access to a map, particularly maps scaled to neighborhoods and areas with which we’re familiar. Most can draw or write about an idea that we want to see made real. These spatial tools are also ones that translate well to the digital realm.
That is the Civic Computing vision – harnessing accelerating innovations in spatial computing and web 3.0 to enact systems of trans-scalar spatial visualization for a future of more collaborative decision-making and civic co-production.
References
Athey, S., Chetty, R., Imbens, G. W., & Kang, H. (2019). The surrogate index: Combining short-term proxies to estimate long-term treatment effects more rapidly and precisely (No. w26463). National Bureau of Economic Research.
Bento, J., & Laopoulou, T. (2019). Spatial design leadership: the role, instruments and impact of state architect (or similar) teams in fostering spatial quality and a place-making culture across five European states. https://www.researchgate.net/publication/343576904_Spatial_design_leadership_the_role_instruments_and_impact_of_state_architect_or_similar_teams_in_fostering_spatial_quality_and_a_place-making_culture_across_five_European_states
Blühdorn, I. (2013). The governance of unsustainability: Ecology and democracy after the post-democratic turn. Environmental Politics, 22(1): 16–36.
Campanella, T.C. (2011). Jane Jacobs and the Death and Life of American Planning. In Reconsidering Jane Jacobs, edited by M. Page and T. Mennel. Chicago, IL and Washington, DC: American Planning Association.
Cechanowicz, L., B. Cantrell and A. McDowell. 2016. World Building and the Future of Media: A Case Study-Makoko 2036. IEEE Technology and Society Magazine, 35 (4): 28-38. doi:10.1109/mts.2016.2618678.
Cruz, T. (2015). Teddy Cruz on Mediating from Bottom-Up to Top-Down. Retreived 10 October, 2021. http://masteremergencyarchitecture.com/2015/04/24/teddy-cruz-on-mediating-from-bottom-up-to-top-down/.
Eberhard, K. (2021). The effects of visualization on judgment and decision-making: a systematic literature review. Management Review Quarterly, 1-48.https://link.springer.com/article/10.1007/s11301-021-00235-8
Einstein, K. L., D. M. Glick and M. Palmer. (2019). Neighborhood defenders: Participatory politics and America's housing crisis. Cambridge University Press.
Huchzermeyer, M., and P. Misselwitz. (2016). Coproducing inclusive cities? Addressing knowledge gaps and conflicting rationalities between self-provisioned housing and state-led housing programmes. Current Opinion in Environmental Sustainability, 20: 73–79.
Idi, D. B., & Khaidzir, K. A. M. (2018). Critical perspective of design collaboration: A review. Frontiers of Architectural Research, 7(4), 544-560.
https://www.sciencedirect.com/science/article/pii/S2095263518300633
Legacy, C. (2016). Is there a crisis of participatory planning? Planning Theory, 16(4): 425-442. https://doi.org/10.1177/1473095216667433
Longstreth, R. (2006). The difficult legacy of urban renewal. The Journal of Heritage Stewardship, 3(1): 6-23.
Ma, H. (2017). Reflections on Public Participation in Urban Planning. In: Proceedings of the 2017 3rd International Conference on Economics, Social Science, Arts, Education and Management Engineering (ESSAEME 2017). https://doi.org/10.2991/essaeme-17.2017.273
Monno, V. and A. Khakee. (2012). Tokenism or political activism? Some reflections on participatory planning. International Planning Studies, 17(1): 85-101.
Munoz-Erickson, T. A. (2014). Co-production of knowledge–action systems in urban sustainable governance: The KASA approach. Environmental Science & Policy, 37, 182-191.
Nassauer, J. I. (2012). Landscape as medium and method for synthesis in urban ecological design. Landscape and Urban Planning, 106(3), 221-229. https://www.sciencedirect.com/science/article/pii/S0169204612001016
Ryan, B. (2012). Co‐production: Option or obligation?. Australian Journal of Public Administration, 71(3), 314-324.
Sideris, S. C. (2021. Participation Without Power: A Critical Discourse Analysis of Community Meetings in North Denver. The Assembly, 3(1), 86-99.
Taranu, J. P. (2009). Building consensus using a collaborative spatial multi-criteria analysis system (Master's thesis, University of Waterloo). https://core.ac.uk/download/pdf/144143247.pdf
van Dijk, T. (2021). What collaborative planning practices lack and the design cycle can offer: Back to the drawing table. Planning Theory, 20(1), 6-27. https://journals.sagepub.com/doi/full/10.1177/1473095220913073
Zhou, C., Su, F., Pei, T., Zhang, A., Du, Y., Luo, B., ... & Xiao, H. (2020). COVID-19: challenges to GIS with big data. Geography and sustainability, 1(1), 77-87.